Next: Trading-Systems
Up: GeniusTrader Manual
Previous: Installing GeniusTrader
Contents
Subsections
Generating Charts
As introduction to the possiblities of GeniusTrader we`ll create some
graphics. The program graphic.pl in the
Scripts-subfolder is capable of creating (nearly) all those nifty charts
you know from commercial packages. Even if the chart-generation is not
the main purpose of GeniusTrader we start with this topic because it is more
intuitive to understand an indicator or a system when you can draw it
on a chart.
In all the examples, we use the example-data provided by the
GeniusTrader-Website, so make sure, you copied those files and added the right
DB::text::directory-variable to your options-file.
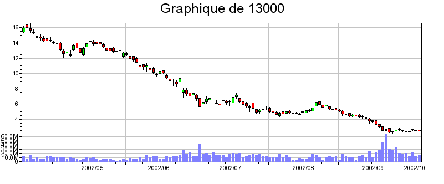
The command
./graphic.pl 13000 > test.png
produces a chart of the 13000-stock using the
default-parameters. The output is a png-file, which is redirected to
test.png. This should look similar to the graphic in
fig. 3.1.
Figure 3.1:
A simple graph using the default parameters of graphic.pl
 |
The graphic can be view by one of the various image viewers. You can
use ee, xv or display. I have some good experiences in using the
display-Program because you can easily scroll larger graphics or I
start a GIMP-session and use gimp-remote to view the images (see man
gimp-remote for further explanations).
Formatting the Chart
The program provides several commandline-options:
 ./graphic.pl [ --timeframe=day|week|month ] [ --nb-item=120 ] \
              [ --start=1999-02-01 ] [ --end=2001-03-23 ] \
              [ --type=candle|barchart|line|none ] [ --volume ]
              [ --volume-height=150 ] [ --title="Daily Chart" ] \
              [ --width=200 ] [ --height=230 ] [ --logarithmic ] \
              [ additionnal graphical elements ] \
              [ --file=conf ]
              <code>
All of these options can be written in a file - one parameter per
line. If the program is called with the file-parameter and the
filename, the options out of the file are loaded. Each line in this
file corresponds to a command line parameter. Lines starting with #
are ignored. As an example, place these lines in a file sma.conf:
 # A sample configuration-file
 --title=Stock of %c
 --add=Switch-Zone(0)
 --add=Curve(Indicators::SMA 200, [255,0,0])
 --add=Curve(Indicators::SMA 38, [0,0,255])
Be aware that you have to omit the quotation marks that you use
normally to tell the bash not to care about the arguments.
If you call now the program with the configuration-file as
parameter, the coresponding modifications take place:
./graphic.pl --file=sma.conf 13000 > test.png
To understand what these parameters do, see below.
Using the timeframe-parameter, the timeframe can be
adjusted. To create a chart on a weekly basis you can use the
following command:
./graphic.pl --timeframe=week 13000 > test.png
The start and the end of the displayed period can be defined
by the parameters start and end.
By default the program displays the last 120 days. You can
change this behaviour by using either the two parameters mentioned
above or the nb-item-parameter. The
following command produces a chart of the last 30 days.
./graphic.pl --nb-item=30 13000 > test.png
To produce a chart of year 2001 you have to use the following command:
./graphic.pl --start=2001-01-01 --end=2001-12-31 13000 > test.png
Changing the look of the chart
To change the look of the chart you can use the
~/.gt/options-file and several commandline-options.
In the configuration-file you can specify the default colors as in the
following example:
Graphic::Histogram::Color lightblue
Graphic::BackgroundColor black
Graphic::ForegroundColor white
This produces the histograms by default in a lightblue and uses white
as foreground and black as background color. By looking at the sources
of the GT::Graphics-folder you'll find an option for nearly all colors
used in a chart.
The following graphical options are available:
Graphic::BackgroundColor: Color of the background
Graphic::BarChart::DownColor: Color of the Bars where the
stock moves down
Graphic::BarChart::UpColor: Color of the Bar where the
stock moves up
Graphic::BarChart::Width: Widht of one Bar
Graphic::BuySellArrows::BuyColor: Color of the ``Buy''-BuysellArrow
Graphic::BuySellArrows::Distance: Distance between Candle
and arrow
Graphic::BuySellArrows::SellColor: Color of the ``Sell''-BuysellArrow
Graphic::Candle::DownColor: Color of the Candles where the
close is lower that the open
Graphic::Candle::Height:
Graphic::Candle::UpColor: Color of the Candles where the
close is higher that the open
Graphic::Candle::Width: Width of onw Candle
Graphic::ForegroundColor: Default foreground-color
Graphic::Grid::Color: Color of the grid
Graphic::Histogram::Color: Color of the Histogram
(e.g. the volume)
Graphic::Marks::Color: Color of the Marks
Graphic::Marks::Width: Width of the Marks
Graphic::Mountain::Color: Color of the Mountain
Graphic::PointAndFigure::DownColor: Color of the P&F-Circles
Graphic::PointAndFigure::UpColor: Color of the P&F Crosses
Graphic::PricesColor::Down:
Graphic::PricesColor::Equal:
Graphic::PricesColor::Up:
Graphic::Text::Color: Color of the Text
Graphic::VotingLine::BuyColor: Color of the Voting-Line
for a long-position
Graphic::VotingLine::Height: Height of the Voring-Line
Graphic::VotingLine::SellColor: Color of the Voting-Line
for a short-position
Graphic::VotingLine::Width:
By using the commandline-parameter title, you can change the
title. If the string contains a %c, this part is replaced by
the code of the stock.
The type of the chart can be changed by the parameter type. The
possibilities are candlestick (candle) which is the default,
barchart (bar), linechart (line) or no chart
(none).
To disable the display of the volume-chart use the parameter
--novolume. The height of the volume-chart is adjusted by the
volume-height-parameter.
The width and height of the hole chart is normally automatically
adjusted (Hint: if the chart is getting very large, the
display-program from the ImageMagick-toolkit is very useful because it
allows to select in a panel the part of the image to be displayed. If
you want to edit th chart you should start GIMP and open the
charts using the command gimp-remote). To specify the width and
height manually, you have to use the width- and
height-parameter:
 ./graphic.pl --title="Graph of %c" --start=2001-12-01 \
      --end=2001-12-31 \--width=600 13000 > test.png
The parameter logarithmic creates a logarithmic axis for the
stock value.
The possibility to place additional graphical elements in the chart
is the most important feature of the graphical frontend.
In GeniusTrader the chart is composed of zones. The fist zone (no. 0) is the
main zone, 1 is the volume zone if it exists. To create a new zone you
have to use the command
New-Zone(height, [left, right, top, bottom])
After applying this command, a new zone with the height height
is created and using the parameters above, below, right or left you
can specify the border of the graphic.
While adding more graphical elements, you can switch the zone using
the command
Switch-Zone(zoneid)
This changes the current display zone, which is particular useful if
you want to add indicators (like moving averages) to the main-zone.
All the commands described later are applied for the current display
zone.
Formatting the zone
Not only the main zone, but every zone can be formated using the
corresponding add-commands:
Set-Scale(min,max,[logarithmic]) or Set-scale(auto,[logarithmic])
This defines the scale for the currently selected zone (by default the
last zone created or the main zone if no zone has been created).
Set-Special-Scale(min,max,[log]) or Set-Special-Scale(auto,[log])
The last created object will be displayed with its own scale (and not
the default one of the zone). The scale may be given or it may be
calculated to fit the full zone.
Set-Axis(tick1,tick2,tick3...)
Define the ticks for the main axis of the current zone.
set-title-{left,right,top,bottom}(title,font\_size)
This adds a title to the currently selected zone. The title will be
displayed in the given size (size can be tiny, small, medium, large
and giant). If the title contains a %c, this is replaced by the
code-number.
Adding Graphical Elemnts
Using the --add=""-parameters, you can insert additional
graphical elements in your charts.
Using the command
Text(text, x, y, [halign, valign, font_size, color, font_face])
you can add Text to your graph. The given coordinate are expressed in
percent of the width/height of the zone.
halign can be one of left, center orright. valign can be one of
top,bottom orcenter. font_size can be one oftiny,small,
medium,large orgiant. font_face can be one ofarial,times
orfixed.
The command
  ./graphic.pl --add="New-Zone(100)" \
     --add="Text("MACD", 50, 50, center, center, giant, [200,200,200])" \
     --add="Curve(Indicators::MACD, [0,0,255])" 13000 > test.png
creates a new zone and inserts a kind of background text before it
displays the indicator. This is IMO a nice alternative for the
``normal'' titles.
More important than all the formatting is the question how to insert
indicators, buy/sell-arrows, etc. First you have to chose how to
display the data. GeniusTrader provides four different possibilities to
display data:
Histogram(<datasource>, [color])
Curve(<datasource>, [color])
Marks(<datasource>, [color])
Mountain(<datasource>, [color])
Histogram displays a histogram as you mabe know it from the
MACD-Difference. It is identical to the volume histogram. The Curve is
a simple line - the most usable form. Using the Marks you can
place a line of crosses and by using the Mountain it is
possible to add a area.
Using these commands, one can add a new graphical object in the
current zone. The datasource explains what data has to be
displayed. The color is an array of the R, G and B value ([0,0,0] is
black, [255,0,0] red and so one...).
If the datasource is an indicator, it is important to know how to
provide parameters to the datasource. The parameters of an indicator
are separated by blanks. So you can for example add three moving
averages to the main zone by the following command:
  ./graphic.pl --add="Switch-Zone(0)" \
  --add="Curve(Indicators::SMA  38, [0,0,255])" \
  --add="Curve(Indicators::SMA 100, [0,255,0])" \
  --add="Curve(Indicators::SMA 200, [255,0,0])" 13000 > test.png
Some indicators like Bollinger Bands create multiple data rows. these
rows can be accessed using a slash after the indicator-name:
  ./graphic.pl --add="Switch-Zone(0)" \
  --add="Switch-Zone(0)" \
  --add="Curve(Indicators::BOL/2 25 3, [0,0,255])" \
  --add="Curve(Indicators::BOL/3 25 3, [0,0,255])" 13000 > test.png
This command would create a graph with the upper and lower Bollinger
Band included.
More informations about indicators you find in chapter
5.
By adding BuySellArrows or a VotingLine you can show the buy- and
sell-decisions of a system in a chart.
The following command would create two moving averages and display a
buy or a sell arrow where the short one crosses the log one.
  ./graphic.pl --add="Curve(Indicators::EMA 5,[255,0,0])" \
               --add="Curve(Indicators::EMA 20,[0,0,255])"\
  --add="BuySellArrows(Systems::Generic Signals::Generic::CrossOverUp \
      {I:EMA 5} {I:EMA 20}  Signals::Generic::CrossOverUp {I:EMA 5} \
      {I:EMA 20} )"  13000 > test.png
If you us the Voting-Line as in OmniTrader it is nearly the same:
  ./graphic.pl --add="Curve(Indicators::EMA 5,[255,0,0])" \
               --add="Curve(Indicators::EMA 20,[0,0,255])"\
  --add="VotingLine(Systems::Generic Signals::Generic::CrossOverUp \
      {I:EMA 5} {I:EMA 20}  Signals::Generic::CrossOverUp {I:EMA 5} \
      {I:EMA 20},5.5)"  13000 > test.png
You can indicate the y at which the line should be displayed. In this
example the line is displayed in the height of 5.5.
The objects PortfolioEvaluation(<portfolio>) and
BackTestPortfolio(<systemname>, [directory]) should be described ...
Next: Trading-Systems
Up: GeniusTrader Manual
Previous: Installing GeniusTrader
Contents
|